How it works. One monthly cycle, narrowing.
Nine thousand pools in, one memo out.
The cycle runs five stages, each one narrower than the last, each one leaving a trail. Here is what happens at every stage, and what would break it. Counts below illustrate one month and are not a guarantee.

The cycle
Section 02 · Five stages, one trail
-
Stage 1. Pools disclosed. 9,240.
At month end each agency publishes a loan-level disclosure file for every pool it guarantees. We pull the files overnight, not download them by hand, and normalise three agencies' formats into one schema with the file name, the row and the ingestion time attached to every value. In a sample month that is 9,240 pools. The stage is finished before anyone on your desk is awake. What would break it: a late file. The cycle cannot start before the agency posts.
-
Stage 2. Screened. 1,180.
Your filters run against the normalised universe: balance band, geography, credit score, servicer, seasoning, any field the file carries. The screen is the one you already cut by hand, saved once and versioned after that, so each month's screen is last month's unless someone changed it and the change is logged. In the sample month 1,180 pools pass. What would break it: a screen definition that drifts without a log. Ours cannot, because every edit carries a name and a date.
-
Stage 3. Prepayment modelled. 146.
CPR is how fast borrowers prepay, annualised. For the pools your screen surfaces as candidates, speeds are modelled against your own rate paths, the three or four scenarios your committee argues about, rather than a vendor default. Each run names the scenario, the path and the version that produced it. In the sample month 146 pools are modelled. What would break it: a rate path nobody at your table believes. That is why you supply them.
-
Stage 4. Valued. 18.
Each modelled pool is valued two ways. Spread against the generic, and payup, which is what a hand picked pool earns over the generic price. The comparison is to the generic price from public market data, and the payup that comes out is an estimate, labelled as one. In the sample month 18 pools carry a case worth writing. What would break it: a generic price that moved after the run. The run time is on the sheet so you can tell.
-
Stage 5. Written up. 4.
A memo per name: the thesis in one paragraph, the evidence attached (screen definition, model run, six prints of history), four comparables and where they trade, and a paragraph headed What would break it naming the rate move that makes the payup wrong. In the sample month there are four. Nothing in them was typed. What would break it: a committee question the template did not anticipate. Tell us, and next month's template asks it.
Counts illustrate one month and are not a guarantee.
Research outputs for the customer's own investment professionals. Not a recommendation, an offer or a solicitation. Models are estimates. Figures derive from official agency disclosures and public market data.
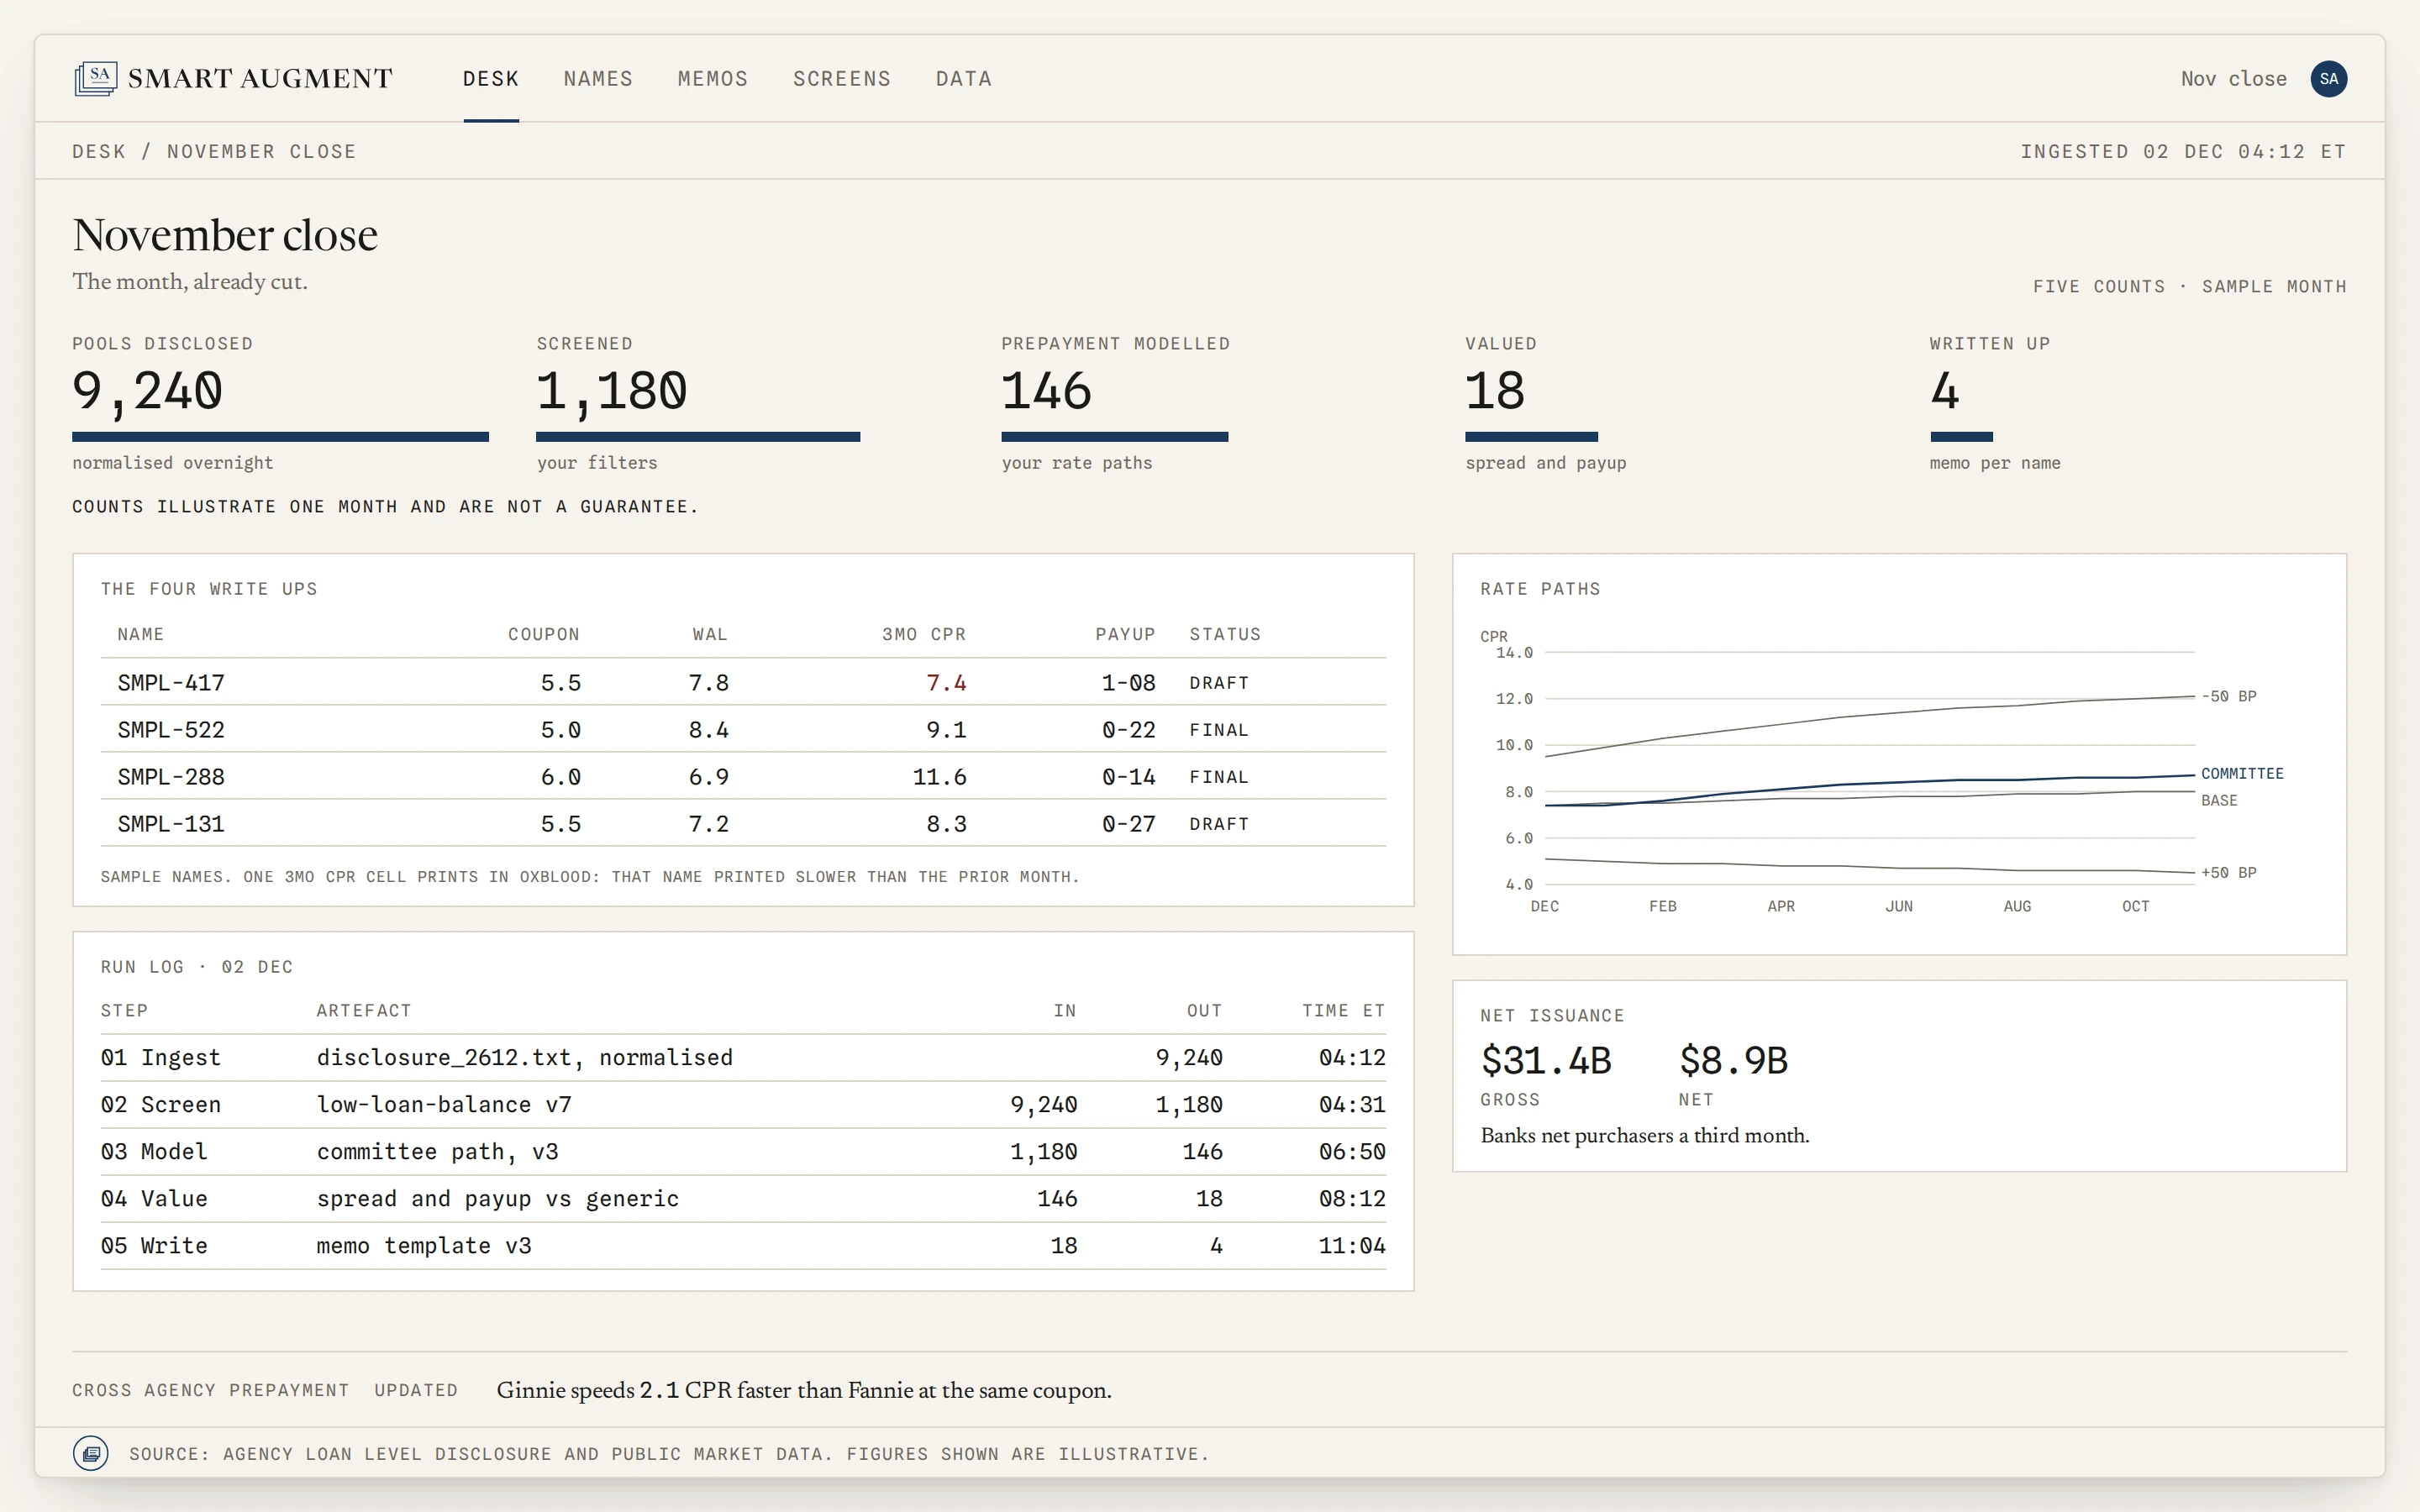
The Desk
The month, already cut, on one screen. Across the top, the five counts of the cycle with the mandatory line beneath them. Left, the four write ups in one table: name, coupon, weighted average life, three month CPR, payup, status. One CPR cell prints in oxblood because that name printed slower than the month before, and that is the only thing oxblood is ever used for. Right, the rate paths as one chart with your scenario highlighted, and net issuance: $31.4B gross, $8.9B net in the sample month, with banks net purchasers a third month. Across the foot, the cross agency line: Ginnie speeds 2.1 CPR faster than Fannie at the same coupon. Sample figures throughout.
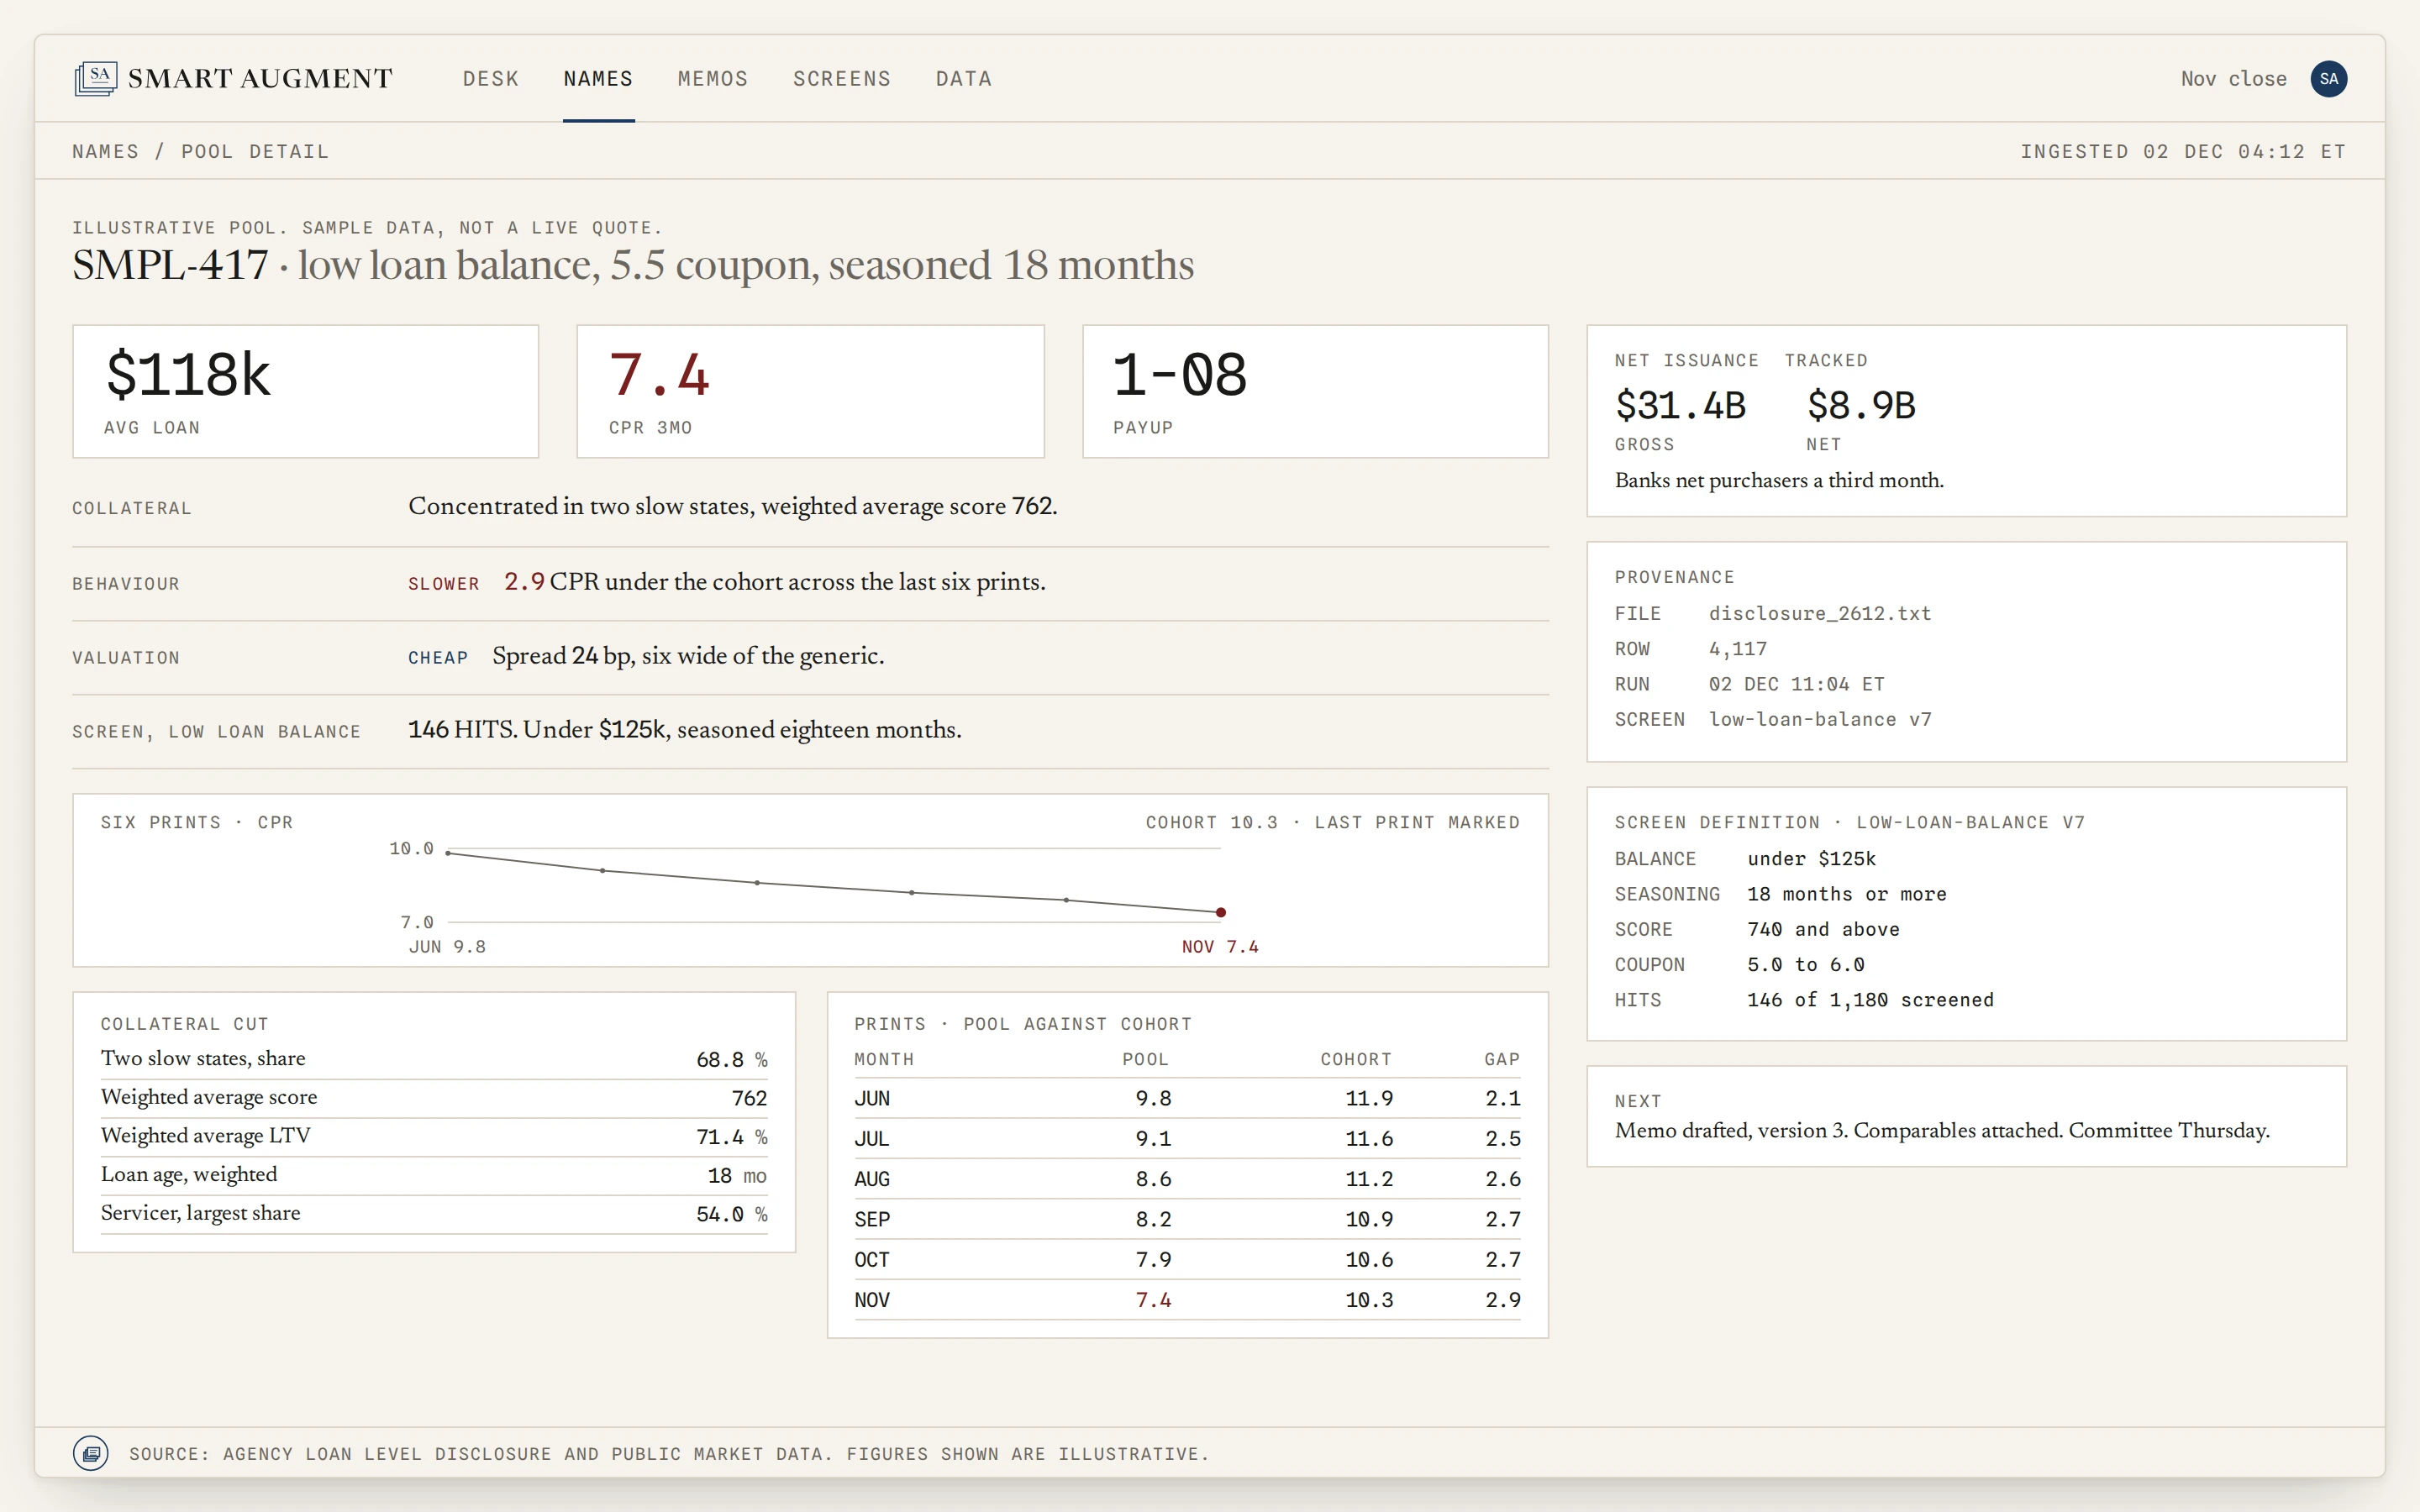
The Name
One pool, its collateral, its behaviour and its price on the same sheet, so the committee never has to reconcile three sources. In the sample: $118k average loan, 7.4 CPR over three months, a 1-08 payup. Collateral concentrated in two slow states, weighted average score 762. Behaviour 2.9 CPR under the cohort across the last six prints, drawn as a sparkline with the latest print marked. Valuation a spread of 24 bp, six wide of the generic, which is the figure the tag beside it describes and never stands without. The low loan balance screen that surfaced this pool returned 146 hits: under $125k, seasoned eighteen months. Illustrative pool. Sample data, not a live quote.
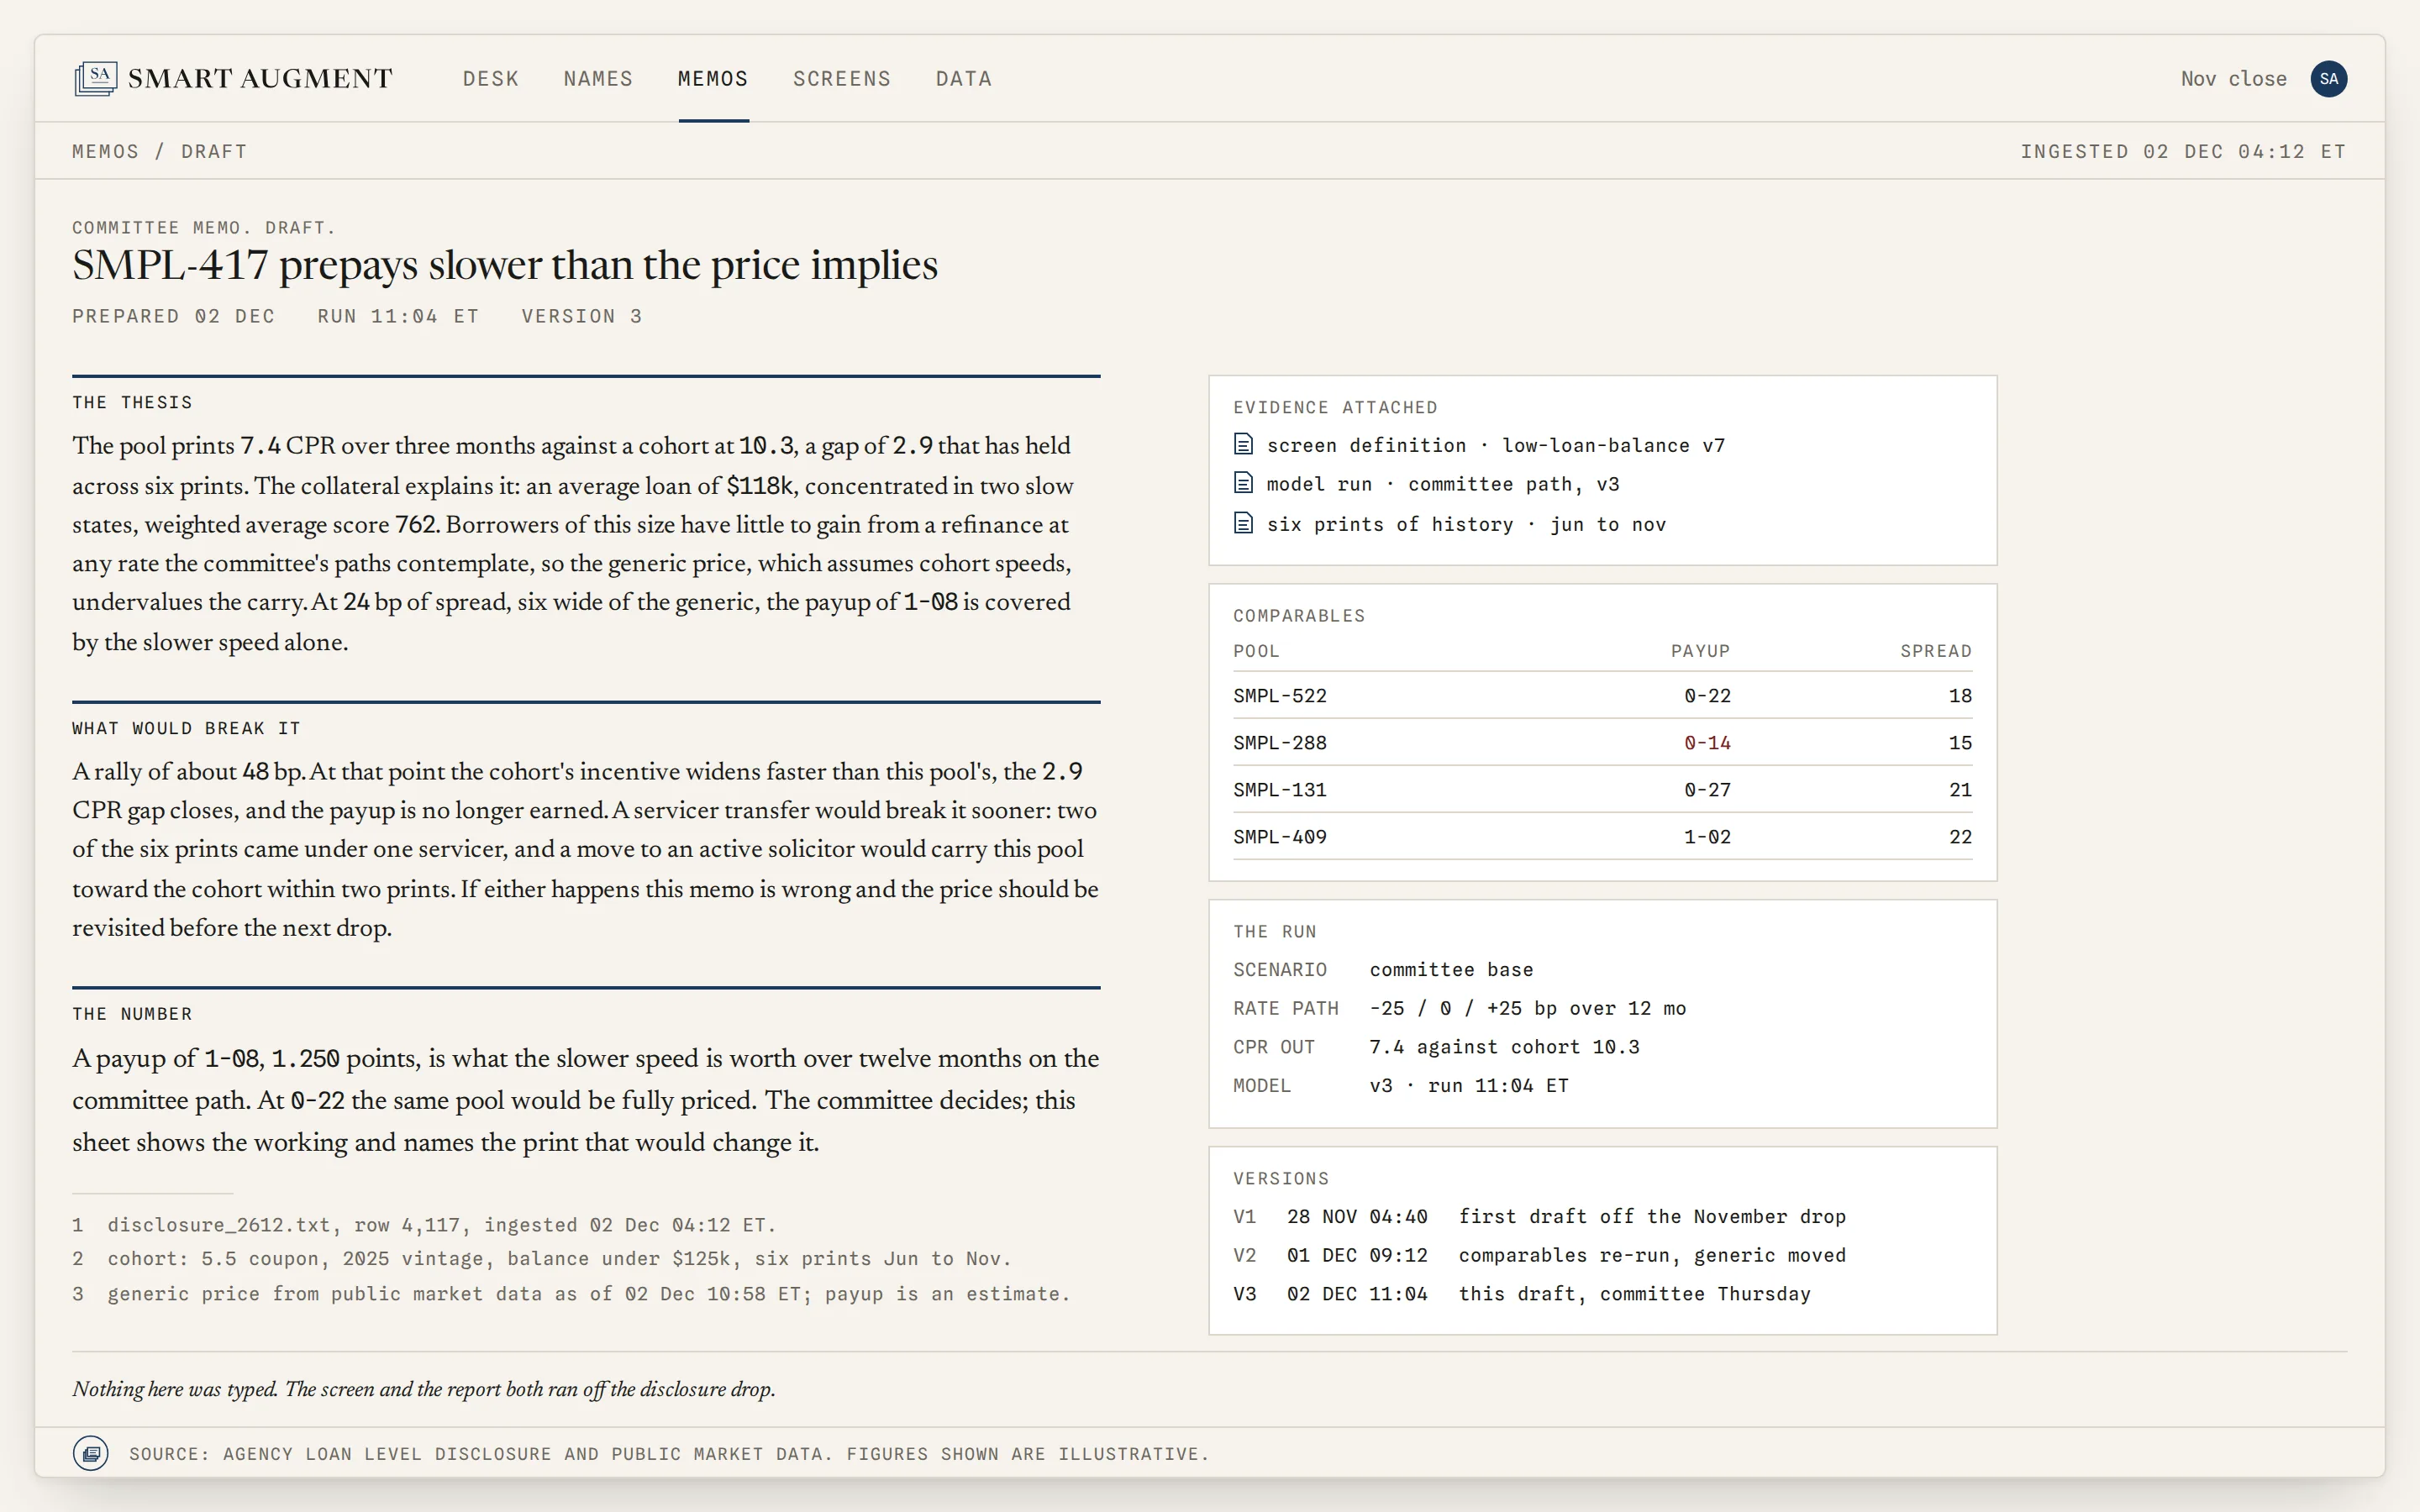
One shell, three bodies: the same top bar, tabs and provenance strip on every screen.
The Memo
The deliverable, laid out as a document because it is one. Left column, two headings: The thesis, one paragraph on why this pool prepays slower than the price implies, and What would break it, one paragraph naming the rate move that makes this payup wrong. Right column, the evidence attached as files (screen definition, model run, six prints of history), a four row comparables table with payup and spread, and the run itself: scenario, rate path, CPR out. Version number and run time in the byline. Written to be read by a committee, and to survive being questioned by one. Nothing here was typed. The screen and the report both ran off the disclosure drop.
The thesis.
What would break it.
SOURCE: AGENCY LOAN-LEVEL DISCLOSURE AND PUBLIC MARKET DATA. FIGURES SHOWN ARE ILLUSTRATIVE.
The Desk. The month, already cut. 9,240 pools disclosed, 146 modelled, 4 written, with the four write ups in one table and the rate paths beside them. Counts illustrate one month and are not a guarantee.
The Name. One pool on one sheet. Sample data, not a live quote: $118k average loan, 7.4 CPR over three months, a 1-08 payup.
The Memo. The deliverable. A thesis, the evidence attached, four comparables, and a paragraph headed What would break it.
Smart Augment publishes research. Nothing here is investment advice and model output is an estimate.
Research outputs for the customer's own investment professionals. Not a recommendation, an offer or a solicitation. Models are estimates. Figures derive from official agency disclosures and public market data.
Provenance statement
Every figure has a trail back to the disclosure row that produced it. The file, the row, the ingestion time, the model version, the scenario. If a number cannot show its row, it does not go on the sheet.
We license no market data terminal and no vendor model, and nothing on this site shows or imitates their output. Our inputs are the official agency disclosures and public market data. Our outputs are estimates with their working attached. What would break it: a figure on any page of this site without a source. If you find one, support@smartaugment.com, and it is sourced or removed.